Performance as a Priority: Building Applications Users Love
I’ll never forget the first time I watched real users abandon my beautifully designed app because it took eight seconds to load. All that elegant code, those thoughtful features—none of it mattered. They were gone before seeing any of it.
That’s when performance stopped being a technical metric and became personal. Every millisecond of delay is someone’s time, someone’s patience, someone’s decision to use your product or your competitor’s.
Performance Is Experience, Not Just Speed
We often reduce performance to load times and benchmarks, but it’s so much more nuanced than that. Performance is the feeling your app gives users.
Perceived performance often matters more than actual performance. An operation that takes three seconds but shows progress feels faster than one that takes two seconds with no feedback. I’ve seen apps that feel fast at 1.5 seconds and apps that feel sluggish at 800ms. The difference? Intentional UX around loading states, skeleton screens, and optimistic updates.
Users form judgments about your application’s quality in milliseconds. Research shows 53% of mobile users abandon sites that take longer than three seconds to load. That’s not a technical problem—it’s a business problem. Every performance issue is a conversion funnel leak.
The Real Cost of Poor Performance
Beyond frustrated users, performance impacts your bottom line in measurable ways.
User experience degrades exponentially. Amazon found that every 100ms of latency cost them 1% in sales. Google discovered that an extra 0.5 seconds in search page load time dropped traffic by 20%. These aren’t small numbers—they’re company-defining metrics.
Operational costs scale with inefficiency. I once inherited a system that processed images synchronously on web servers. During traffic spikes, we’d spin up 20+ servers to handle load. After optimization, the same traffic ran smoothly on three servers. That’s not just faster—it’s 85% cheaper to operate.
Market position depends on speed. Users compare your app to the fastest app they’ve used, not the slowest. When competitors ship faster experiences, you’re not just losing on features—you’re losing on the fundamental experience of using software.
Where Performance Actually Comes From
After optimizing dozens of applications, I’ve learned that performance problems cluster in predictable places. Focus your efforts here first.
Write Code That Doesn’t Work Hard for Nothing
Premature optimization is dangerous, but lazy code is expensive. I’ve seen quadratic algorithms processing hundreds of items when linear ones would do. I’ve found database queries inside loops that should run once. I’ve discovered components re-rendering thousands of times per second for static data.
Profile before optimizing. I use Chrome DevTools for frontend, language-specific profilers for backend (py-spy for Python, pprof for Go). The bottleneck is rarely where you expect. Measure, identify the top three slowest operations, fix those, then measure again.
Common code-level wins:
- Algorithmic complexity: Replace O(n²) with O(n log n) or O(n)
- Avoid premature abstraction: Too many layers kills performance through indirection
- Batch operations: Process collections together, not one at a time
- Cache computed values: Don’t recalculate the same thing repeatedly
Real example: I once found a React component that calculated derived state on every render. Moving that calculation to ‘useMemo’ improved frame rates from 20fps to 60fps—smooth vs janky, just by avoiding unnecessary work.
Manage Resources Like They’re Precious (Because They Are)
Memory leaks, bloated bundles, and wasteful resource usage are silent killers. They don’t always cause immediate problems, but they create death by a thousand cuts.
Memory management matters. In garbage-collected languages, creating unnecessary objects creates work for the GC. In languages like Rust or C++, poor memory management causes crashes. I monitor memory usage in production and set alerts for unexpected growth.
Caching is leverage. But cache carefully:
- Cache computation: Expensive calculations, not cheap lookups
- Cache at the right layer: CDN for static assets, Redis for session data, application memory for hot paths
- Implement cache invalidation: Stale caches are bugs waiting to happen
- Set appropriate TTLs: Balance freshness with performance
I use a layered caching strategy: browser cache (long TTL for versioned assets), CDN (medium TTL for semi-static content), Redis (short TTL for dynamic data), and application memory (very short TTL for hot paths).
Resource pooling prevents waste. Database connections, HTTP clients, thread pools—create them once, reuse them many times. Connection overhead is expensive. I’ve seen APIs go from 200ms to 20ms just by properly pooling database connections.
Minimize Network Overhead Aggressively
Network requests are the slowest operation in most web applications. Every roundtrip across the internet adds latency you can’t eliminate—only minimize.
Reduce request counts:
- Bundle assets: Combine JS and CSS files (but balance with code splitting)
- Use image sprites or icon fonts: Reduce image requests
- Implement GraphQL or efficient REST: Fetch exactly what you need in one request
- Batch API calls: Combine related requests when possible
Compress everything:
- Enable gzip/brotli compression: 70-90% size reduction for text
- Optimize images ruthlessly: Use WebP or AVIF, compress with tools like ImageOptim
- Lazy load images: Use ‘loading="lazy’ or Intersection Observer
- Serve appropriately sized images: Don’t send 4K images to mobile devices
Use CDNs strategically. Content delivery networks put your assets geographically close to users. For static assets, CDNs are non-negotiable. I use Cloudflare or CloudFront and see typical asset load times drop from 400ms to 50ms.
Real numbers: On a recent project, implementing image optimization, lazy loading, and compression reduced initial page size from 4.2MB to 680KB. First Contentful Paint improved from 3.8s to 1.1s. Same content, massively better experience.
Load Smartly: Lazy and Asynchronous Patterns
Users don’t need everything immediately. Prioritize what matters, defer what doesn’t.
Lazy loading delays non-critical resources:
- Below-the-fold content: Load images and components as users scroll
- Route-based code splitting: Only load JavaScript for the current page
- Modal and drawer content: Load when opened, not on page load
- Heavy libraries: Import dynamically when needed
I use React’s ‘lazy()’ and ‘Suspense’ for component-level code splitting. Routes that include heavy charting libraries or rich text editors load on-demand, not upfront. Initial bundle size stays small.
Async operations keep UIs responsive:
- Non-blocking I/O: Never block the main thread waiting for data
- Web Workers: Offload heavy computation to background threads
- Debounce and throttle: Limit how often expensive operations run
- Optimistic updates: Update UI immediately, sync in background
Critical rendering path optimization:
- Inline critical CSS (above-the-fold styles)
- Defer non-critical CSS
- Async or defer JavaScript that’s not immediately needed
- Preload key resources with ‘’
Design for Scale from Day One
Scalability isn’t something you add later—it’s architectural decisions you make early.
Horizontal scaling beats vertical scaling. Adding more servers is easier and cheaper than upgrading to bigger servers. Design stateless services that can scale out. Store session data in Redis, not in-memory. Use load balancers to distribute traffic.
Database strategies for scale:
- Read replicas: Offload read traffic from your primary database
- Connection pooling: Reuse connections, don’t create them per request
- Query optimization: Index properly, avoid N+1 queries, use EXPLAIN plans
- Consider caching layers: Redis, Memcached for frequently accessed data
- Eventual consistency: Accept slightly stale data for massive performance gains when appropriate
Microservices vs monoliths: Start with a well-structured monolith. Split into services when you have clear performance or team boundaries that justify the operational complexity. I’ve seen premature microservices create more problems than they solve.
Auto-scaling in the cloud: Configure auto-scaling groups that add capacity during traffic spikes and reduce it during quiet periods. Monitor key metrics (CPU, request rate, response time) and scale based on actual demand.
Real story: A previous startup I worked with ran everything on manually managed servers. During a viral moment, traffic spiked 40x and the site went down for hours. After migrating to AWS with proper auto-scaling, similar spikes scaled automatically in minutes. Peace of mind is worth the migration effort.
Monitor, Measure, and Optimize Continuously
Performance isn’t a one-time achievement—it’s an ongoing practice. What’s fast today becomes slow as you add features, users, and data.
Synthetic monitoring tracks key metrics:
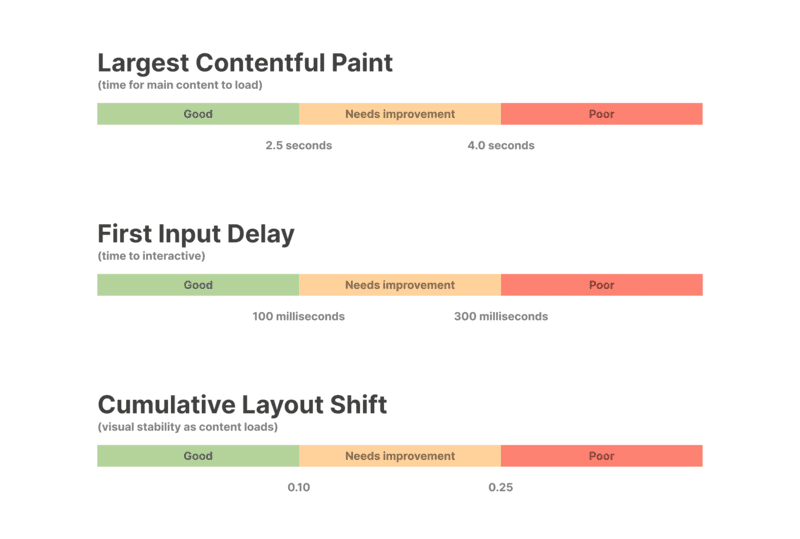
- Core Web Vitals: LCP, FID, CLS (Google’s UX metrics)
- Time to First Byte (TTFB): Server response speed
- First Contentful Paint (FCP): When users see something
- Time to Interactive (TTI): When the page is fully usable
I use Lighthouse CI in my deployment pipeline. Any regression in Core Web Vitals fails the build. This prevents performance degradation from sneaking into production.
Real User Monitoring (RUM) shows actual experience:
Synthetic tests from one location don’t represent global users. RUM collects performance data from real users on real devices and networks. I use tools like Sentry, New Relic, or DataDog to aggregate this data.
Set performance budgets: Define maximum acceptable values for key metrics and enforce them in CI/CD:
- JavaScript bundle size: < 200KB compressed
- Total page weight: < 1MB
- LCP: < 2.5s
- FID: < 100ms
Alert on degradation. Configure alerts for:
- P95 response time increases
- Error rate spikes
- Apdex score drops (user satisfaction metric)
- Resource utilization thresholds
Analyze and iterate. Review performance data weekly. Look for trends, identify problem areas, prioritize fixes based on user impact. Make performance a standing agenda item in sprint planning.
The Performance Mindset
The best performance optimizations I’ve implemented came from asking one question repeatedly: “Does this need to happen, and does it need to happen now?”
Every line of code you don’t execute is infinitely fast. Every network request you don’t make can’t be slow. Every byte you don’t send is instantly delivered. Performance often comes from elimination, not optimization.
Start with the user experience. Understand your users’ devices, network conditions, and usage patterns. Optimize for the 75th percentile user, not the developer on a fast connection with a powerful laptop.
Make performance visible. Display loading states, progress indicators, and skeleton screens. Even when operations take time, users tolerate delays better when they understand what’s happening.
Build performance into culture. Make it part of code reviews, sprint goals, and engineering values. Celebrate performance wins like you celebrate feature launches. The fastest feature is one that loads instantly and works smoothly.
The Competitive Edge
In my experience, most applications are slower than they need to be because performance was treated as an afterthought. The teams that win are those that make performance a first-class concern from architecture through deployment.
Fast applications feel modern, professional, and trustworthy. They respect users’ time and attention. They handle traffic spikes gracefully and cost less to operate. They rank better in search engines and convert users at higher rates.
Performance isn’t a technical checkbox—it’s a competitive advantage that touches every part of your business. Invest in it early, measure it constantly, and never stop optimizing. Your users will reward you with their time, attention, and loyalty.
And when you ship something truly fast, when users remark on how responsive it feels, when competitors wonder how you did it—that’s when you’ll know that every millisecond of optimization was worth it.